


Gravity survey
The gravity survey comprises 350 gravity stations with a 500 m spacing, covering about 185 km profile length (Fig. 1). Bouguer corrected gravity data (correction density: 2300 kg/m3; reference level: 820 m a. s.l.) have resulted in a Bouguer anomaly map (Fig. 1). It shows a complex gravity field which, apart from the impact, could already be expected from the known lithological and structural setting in the Azuara region. The gravity field is dominated by a strong regional gradient superimposed by an overall negative anomaly within the Azuara structure. For further analysis a provisional regional gravity field (Fig. 2) has been subtracted. Since the survey lacks gravity stations outside the Azuara structure, this regional field is based on the Bouguer map, 1:1,000,000, for the Iberian Peninsula (IGCE, 1976) and data kindly supplied by A. Casas (Barcelona).

Fig. 1. Azuara impact structure: Provisional Bouguer anomalies. Counter interval 1 mgal.

Fig. 2. Azuara impact structure: Provisional gravity regional field. Counter interval 1 mgal.
The lack of sufficient station density suggested the computation of Bouguer residual anomalies (Fig. 4) for selected profiles (Fig. 3). They display a broad gravity minimum within the roughly ring-like border of the Azuara structure. The amplitude amounts to roughly -10 mgal. A pronounced negative gravity anomaly conforms to nearly all impact structures for which gravity surveys exist. Ejection, brecciation, and shockwave-induced microfracturing are regarded as to cause the main mass deficit. Moreover, the amplitude of c. -10 mgal proves to be reasonable; impact structures of comparable size show the same order of magnitude (Pohl, J. (1990), Fennoscandian Impact Symposium, May 29-31, 1990, Espoo, Finland.). Some caution is necessary, however, since the impact sites under consideration have in part a markedly different internal structure as well as sedimentation and erosion history. In addition, the amplitude of the Azuara anomaly depends on the choice of the regional field contours.

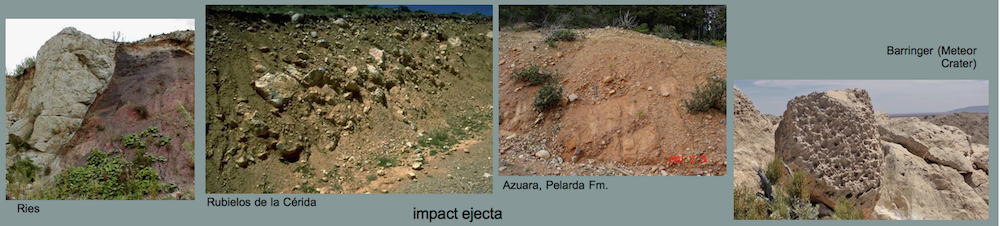
Fig. 3. Location map for selected gravity profiles. 1= Paleozoic, 2 = Mesozoic, 3 = Pelarda Fm. impact ejecta, 4 = Cenozoic.

Fig. 4. Profiles of provisional gravity residual anomalies in the Azuara structure. For the location of the profiles see Fig. 3. Zero axis corresponds to the intersection of the profiles.
The six radial gravity residual profiles from Fig. 4 have been stacked to yield a mean radial profile (Fig. 5) as a basis for simple model calculations. The structure of the model (Fig. 5.) has been adapted to results of similar computations for other large impacts (e.g., Rochechouart (Pohl et al., 1978; Schmidt, 1984), Ries (Jung et al., 1969; Ernstson & Pohl, 1977), and it is evident that a fundamentally different density distribution does not need consideration. As in the case of the Ries and Rochechouart impacts, a rather flat structure, some kilometers deep, satisfies the measured gravity. The mass deficiency of the model totals 1.24 x 10¹⁴ kg, which is within the frame of gravity-derived data for other large impact structures (Fig. 6).

Fig. 5. Model calculations for the Azuara gravity anomaly. Top: Radial profile of averaged Bouguer residual gravity. Bottom: Density model of circular symmetry. M = total mass of the model.

Fig. 6. Gravity-derived mass deficiencies as a function of diameter for terrestrial impact structures. Data from Pohl et al. (1978, and references therein), Ernstson (1984).
As a rule, complex impact structures show gravity anomalies which are also complex. Inner rings, a central uplift, peripheral graben zones, and breccia deposits may contribute to local anomalies of both signs and of roughly circular symmetry which superimpose the main negative anomaly. In this connection, the observation of relative positive anomalies which form a ring-like gravity pattern inside the Azuara morphological rim (Fig. 4 and Fig. 7) is striking. From Fig. 7, a diameter of about 17 km is derived which is roughly half the diameter of the main ring. The local gravity anomalies may be explained by Mesozoic and/or Paleozoic rocks, which form a structural inner ring covered by low-density Tertiary sediments.

Fig. 7. Inner ring (?) of the Azuara structure. The dashed line traces relative positive anomalies shown in Fig. 4. Geology same as in Fig. 3.
Geomagnetic survey
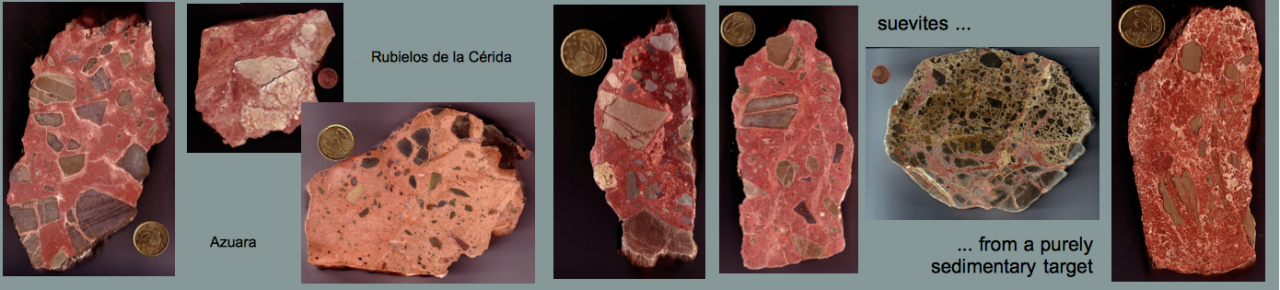
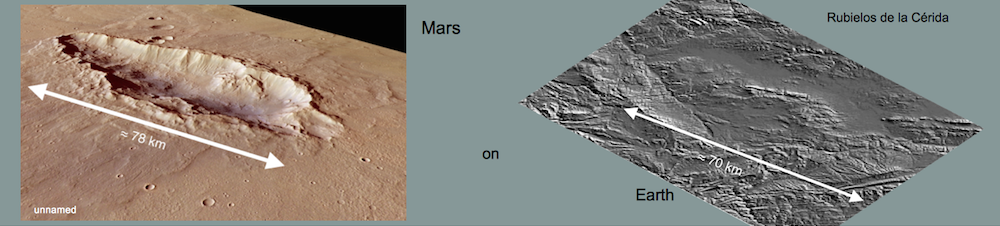
The 35 – 40 km-diameter Azuara impact structure is exceptional because of its purely sedimentary target of about 10 km thickness. Although this thick sedimentary target is to a large amount composed of carbonate rocks and quartzites, significant magnetic anomalies obviously related with the crater structure are measured (Fig. 2) [full article Ernstson, K. & Fiebag, J. (1992): The Azuara impact structure (Spain): new insights from geophysical and geological investigations. – Int. J. Earth Sci., 81, 403-427; http://www.springerlink.com/content/h3817t72781601tn/ ].
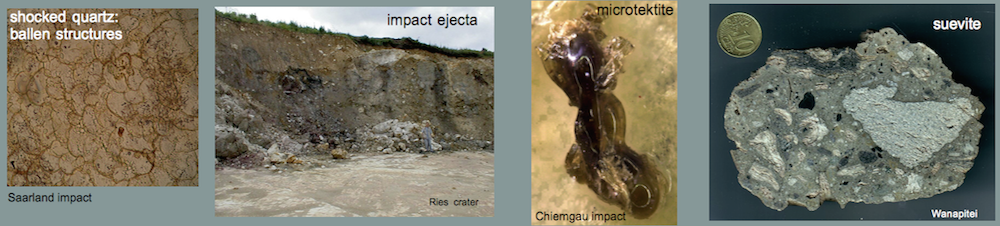
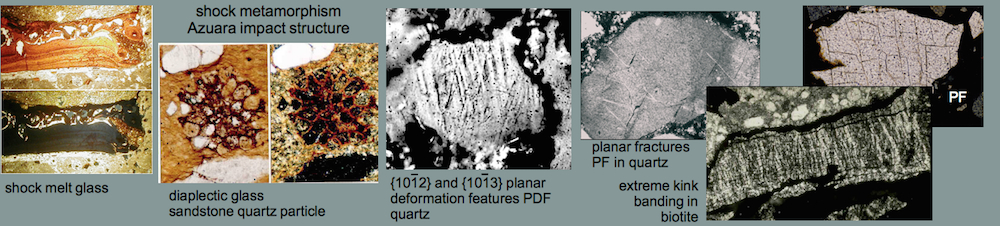
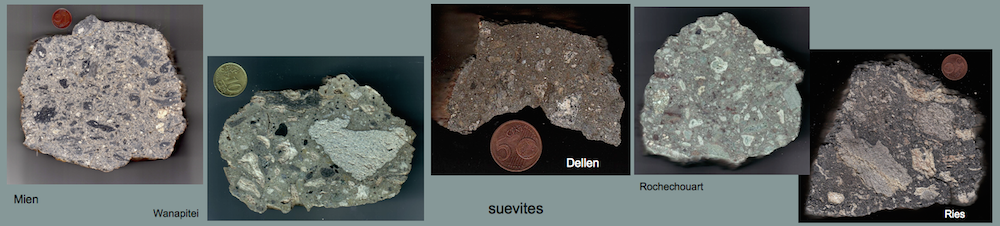
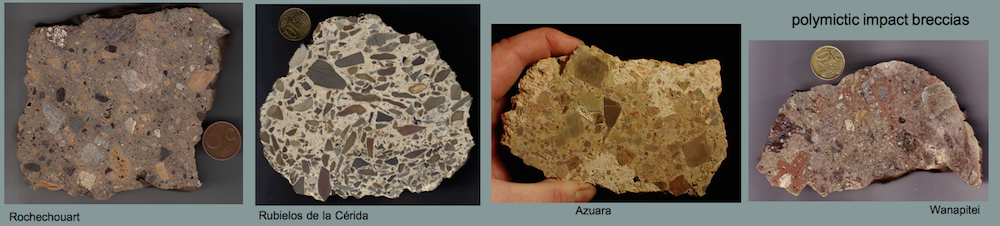
From rock magnetic susceptibility measurements it is very probable that the suevitic basal breccia [https://www.impact-structures.com/impact-rocks-impactites/the-suevite-page/suevites-from-the-azuara-and-rubielos-de-la-cerida-spain-impact-structures/] must be considered the causative body of the anomalies. While crater carbonate rocks and sandstone have maximum susceptibilities of the order of 10 – 20 * 10-3 SI, susceptibilities up to 1.6 * 10-3 SI for basal breccia samples have been measured. Moreover, basal breccia samples may show a significant remnant magnetization. From the frequently distinct reddish color of the suevitic basal breccia we conclude that on formation of the basal breccia new magnetic phases occurred possibly due to strongly enhanced temperatures at the same time responsible for a thermo-remnant magnetization.
In a strongly simplified model (Fig. 4) we show how the concentration of the Azuara magnetic anomalies in the outer zones of the impact structure (see Fig. 2) can be explained.

Fig. 8. Total-field magnetic and gravity profile across the Azuara impact structure (Fig. 3). Model for the origin of the magnetic anomalies in Fig. 4.

Fig. 9. The combined geomagnetic and gravity profile of Fig. 2 across the Azuara impact structure (roughly delineated by the dotted line). Image: Google Earth.

Fig. 10. Simple model for the source of the magnetic anomalies of the Azuara impact structure.
References
Ernstson, K.: A gravity-derived model for the Steinheim impact crater. – Geol. Rundschau, 73, 2, 483-498, 1984.
Ernstson, K. & Pohl, J.: Neue Modelle zur Verteilung der Dichte und Geschwindigkeit im Ries-Krater. – Geologica Bavarica, 75, 355-371, 1977.
Ernstson, K. & Fiebag, J. (1992): The Azuara impact structure (Spain): new insights from geophysical and geological investigations. – Int. J. Earth Sci., 81, 403-427
IGCE (Instituto geográfico y catastral España): Mapa gravimétrico, Peninsula Ibérica e Islas Baleares. Anomalias Bouguer Sistema, 1967.
Jung, K., Schaaf, H. & Kahle, H.-G.: Ergebnisse gravimetrischer Messungen im Ries. – Geologica Bavarica, 61, 337-342, 1969.
Pohl, J.: Comparative gravity and magnetic studies of impact structures (Abstr.). Fennoscandian Impact Symposium, May 29-31, 1990, Espoo, Finland, 1990.
Pohl, J., Ernstson, K. & Lambert, P.: Gravity measurements in the Rochechouart impact structure (France). – Meteoritics, 13, 601-604, 1978.