

Gravity surveys of impact structures
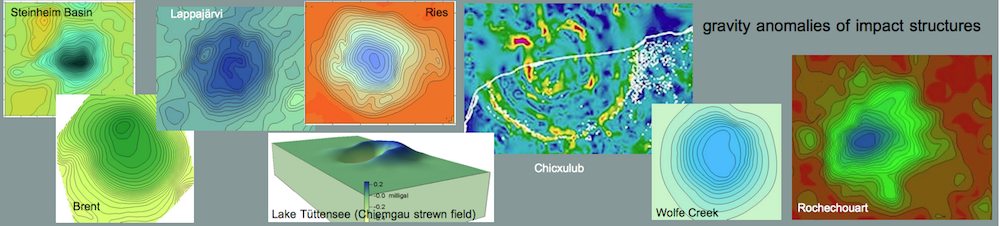
Gravity anomalies in impact structures may result from quite different processes. Small, simple craters in general show a roughly circular negative anomaly (e.g., Fig. 11). A low-density breccia lens at the crater floor, post-impact young crater sediments, and fracturing of the rocks beneath and around the crater may contribute to the mass deficit.
In larger, complex craters with central uplifts and/or rings, gravity anomalies may be complex as well (e.g., Fig. 15). Like in simple craters, rock fracturing and low-density impact melt rocks, suevites and other breccias cause negative anomalies, and post-impact crater sediments may also contrast with the pre-impact target rocks. In addition, relatively positive anomalies are measured, if rocks of higher density were uplifted in the modification stage of the cratering process to form the above-mentioned uplifts and rings. Shock lithification of porous rocks may also lead to locally increased density.
In this context, gravity measurements prove to be a valuable tool in the investigation of impact structures. They are important to detect buried impact structures (as for example the famous giant Chicxulub structure (Fig. 19) and they can trace the original size of deeply eroded craters where only relics of impactites point to an impact origin (as for example the Rochechouart impact structure; see below: Fig. 1).
Gravity potential theory tells us that from the integration over a gravity negative anomaly the total mass deficit can be calculated regardless of the specific density distribution. As in impact structures the mass deficit is related with the kinetic energy of the projectile, impact energy considerations and estimates of the displaced masses are possible (see below: Ries impact structure, Fig. 4). On the other hand, density modeling of gravity anomalies may show details about the internal structure of impact craters (see below: Steinheim Basin impact structure; Figs. 6, 7).
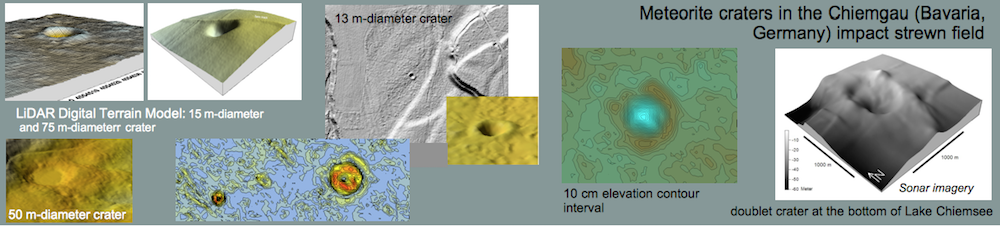
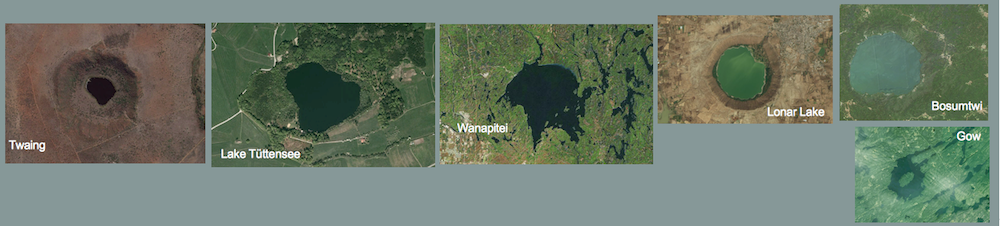
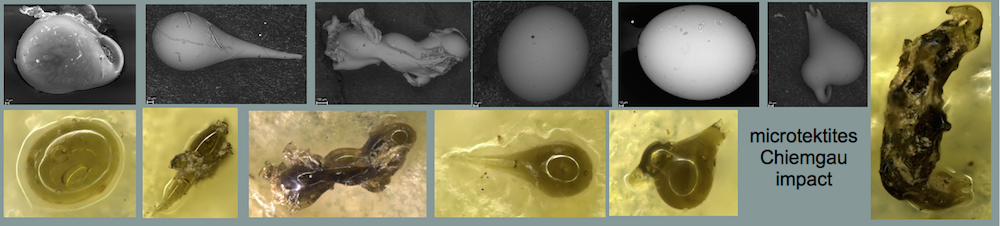
Even very small impact craters may reveal a significant anomaly as is shown by the Lake Tüttensee crater that formed in the Holocene Chiemgau impact event (Figs. 8, 9, 10).
Examples:
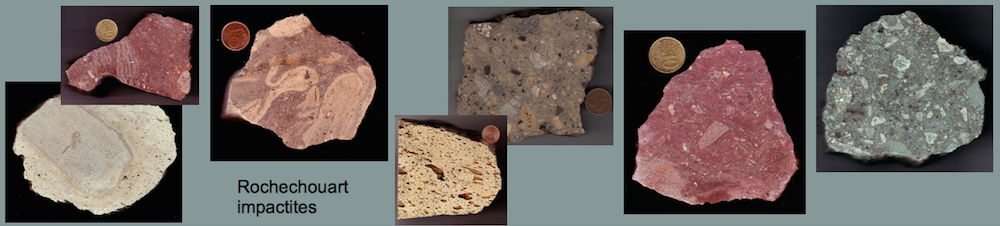
Rochechouart impact structure (France)
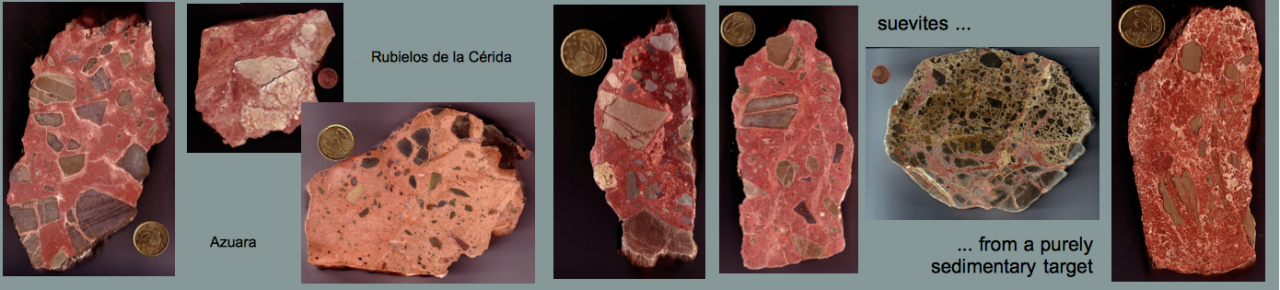
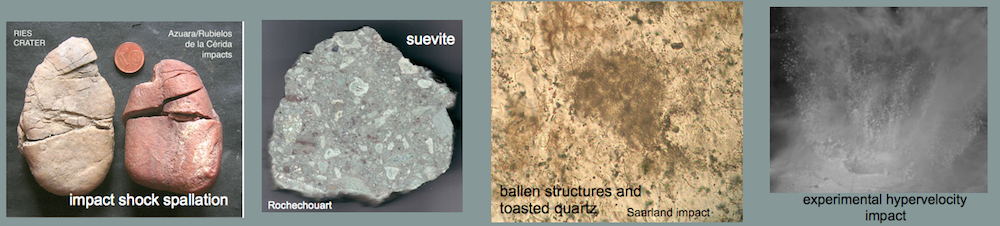
The Rochechouart impact structure is located in the Massif Central of France. The structure is deeply eroded, and only relics of impact melt rocks, suevites and other impactites are exposed. The Bouguer residual anomaly (Fig. 1; modified from Schmidt, T. (1984): Bearbeitung und Auswertung von Schweremessungen im Gebiet der Impakt-Struktur von Rochechouart (Massif Central, Frankreich). – Diploma thesis, University of Munich.) has an amplitude of roughly -10 mGal. From model calculations, Schmidt concludes that the diameter of the original impact structure was between about 25 and 30 km. The mass deficit corresponds to about 40,000 megatons.

Fig. 1. Bouguer gravity residual anomaly of the Rochechouart (France) impact structure.
From the Bouguer residual anomaly, the 2nd horizontal derivative has been calculated (see Fig. 2). In this field, NW – SE and NE – SW trending linear contours come to the fore. They suggest that the gravity field of the Rochechouart impact structure is influenced also by regional structural trends (see photolineation map, Lambert 1974; Bischoff & Oskierski 1987; geological map 1 : 50,000, Sheet Rochechouart, Chèvremont & Floc’h 1996).

Fig. 2. Rochechouart impact structure: 2nd horizontal derivative of the Bouguer residual anomaly.
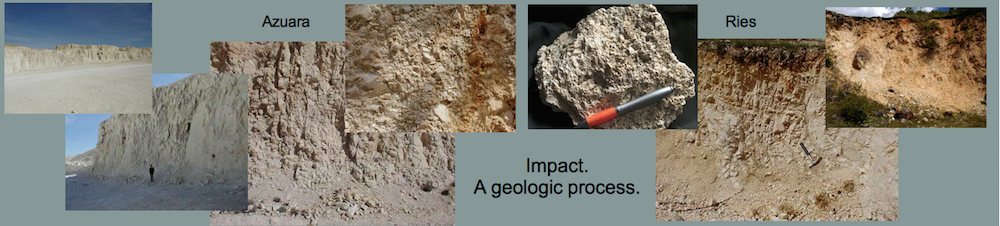
Ries impact structure (Germany)
The 26 km-diameter 15 m.y. Ries impact structure is located in southern Germany. The crater is well preserved and one of the best investigated impact structures. The Bouguer negative anomaly of the Ries crater is embedded in a regional field with considerable “relief” (Fig. 3), which implies several possibilities to construct a reliable residual field (Fig. 4).

Fig. 3. The Ries gravity negative anomaly embedded in a complex regional field.

Fig. 4. Bouguer residual anomaly of the Ries (Nördlinger Ries) impact structure.
The Bouguer residual anomaly shown here (Fig. 4; modified from Kahle, H.-G. (1969): Abschätzung der Störungsmasse im Nördlinger Ries. – Z. Geophys., 33, 317-345.) amounts to about -19 mGal from which roughly 5 mGal may be attributed to the post-impact lake sediments. In Fig. 5, the horizontal gradient of the residual field is shown clearly documenting the complex structure of the Ries crater with a 12 km-diameter inner ring.

Fig. 5. Ries impact structure: horizontal gradient of the gravity residual anomaly. The bluish rings (~ 19 km and 10 km diameters) with maximum gradient delineate the outer rim of the impact basin and the rim of the inner crater.
From the residual anomaly (related to 400 m a.s.l.), a total mass deficiency between about 70,000 and 100,000 megatons has been computed. Adding the masses of the lake sediments, the fallback suevite, and the mass of sediments ejected from above 400 m a.s.l., a total of at least 300,000 megatons were excavated, which correspond with an impact energy of roughly 1026 – 1027 erg (Pohl et al. 1977).
Steinheim Basin impact structure (Germany)
The Steinheim Basin with a prominent central uplift is thought to be a smaller companion to the Ries crater. The central negative anomaly (Fig. 6) hardly exceeds – 2 mGal, and it is surrounded by a discontinuous ring of slightly positive anomalies (diameter 5 – 6 km). The influence of tectonic structures may have been the cause of stronger deviations from a circular symmetry. Density models for crater-crossing profiles are shown in Fig. 7.

Fig. 6. Bouguer residual anomaly of the Steinheim Basin impact structure.
 Fig. 7. Density models for the Steinheim Basin impact structure. From the models it is evident that the crater has a much larger (7-8 km) diameter than the commonly quoted 3.8 km.
From these gravity measurements and additional morphometric considerations, a much larger (~ 7-8 km) than the commonly mentioned 3.7 km-diameter is very probable (Ernstson, K. (1984): A gravity-derived model for the Steinheim impact structure. – Int. J. Earth Sci., 73/2, 483-498. However, even in recent papers on modeling the Steinheim impact process (Stöffler et al. (2002): http://www.lpi.usra.edu/meetings/lpsc2002/pdf/1871.pdf , Ivanov and Stöffler (2005): http://www.lpi.usra.edu/meetings/lpsc2005/pdf/1443.pdf), a small 3.8 km diameter for the Steinheim structure is used making the results of these cratering models rather suspect.
Tüttensee crater, Chiemgau impact strewn field (Germany)
The gravity anomaly of the Lake Tüttensee crater (Fig. 8) is remarkable because of the ring-shaped zone of relatively positive anomalies surrounding the central negative anomaly. The positive anomalies are explained by a model of soil liquefaction and post-liquefaction densification well known from large earthquakes. Moreover, mass flow behind the impact shock front could have contributed to the compaction of the Quaternary loose, highly porous and water-saturated target rocks. The impact densification model is substantiated by a gap in the northern part of the positive ring-like anomaly. Here, a moraine ridge of densified glacial rock material obviously resisted further densification upon impact, in contrast with the otherwise highly porous Quaternary fluvial sediments.
 Fig. 8. Bouguer residual anomaly of the 600 m-diameter Lake Tüttensee meteorite crater.
 Fig. 9. In a 3-D visualization, the ring of gravity positive anomalies around Lake Tüttensee crater becomes particularly evident.
 Fig. 10. In the field of the horizontal second derivative of the Tüttensee Bouguer anomaly the circular shape of the crater anomaly becomes more accentuated at the same time exhibiting an outline of interfering smaller circles. This may indicate a pre-impact disintegration of the Lake Tüttensee projectile.
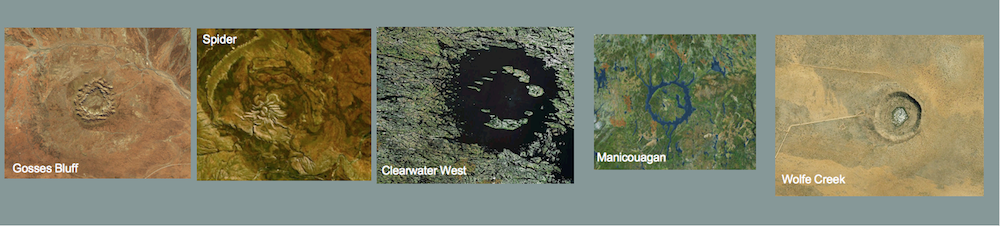
Wolfe Creek meteorite crater, Australia
 Fig. 11. Bouguer gravity residual anomaly of the 900 m-diameter Wolfe Creek crater. Modified from Fudali (1979).
 Fig. 12. Horizontal gradient of the Wolfe Creek gravity residual anomaly. The contour of the maximum gradient (blue) describes a nearly perfect circle delineating the base of the crater inner rim.
Brent meteorite crater (Canada)
 Fig. 13. Gravity anomaly of the 3.8 km-diameter Brent crater. Modified from Chavez (1986).
 Fig. 14. Brent crater: Gravity contours over NASA World Wind satellite imagery.
Lappajärvi (Finland) impact structure

Fig. 15. Gravity Bouguer map of the 17 km-diameter Lappajärvi (Finland) impact structure. Modified from Geological Survey of Finland, Department of Geophysics, 1976.
Manicouagan (Canada) impact structure
 Fig. 16. Bouguer gravity map of the 100 km-diameter Manicouagan impact structure (Fig. 17).
 Fig. 17. The Manicouagan impact structure (Google Earth). Scale bar 100 km.

Fig. 18. Manicouagan gravity field superimposed on Goggle Earth satellite imagery.

Fig. 19. Gravity field of the Chicxulub impact structure, Mexico; map of the horizontal gradient. The diameter of the prominent semicircle of gradient maximum is about 170 km. Source: USGS. White spots are karstic sinkholes (cenotes) in part obviously corresponding with the crater structure. The white line is the coast line of the Yucatán peninsula.