


Seismic reflection and refraction measurements belong to the most powerful tools geophysicists have to hand. This applies also to the investigation of impact structures. However, seismic surveys are in general cost-intensive, and that is why they are rarely done in this field of predominantly scientific interest. On the other hand, burried impact structures have been detected and investigated by seismic surveys carried out for oil companies (for example the Steen River structure in Canada and the Silverpit structure in the southern North Sea).
The Montagnais (Canada) impact structure
Fig. 1 shows a seismic time structure map (modified from Jansa, L. F. et al. (1989): Montagnais: A submarine impact structure on the Scotian Shelf, eastern Canada. – Geol. Soc. Am. Bull., 101, 450-463.) of the submarine Montagnais impact structure which has been recognized from seismic reflection data during oil exploration.
 Fig. 1. The 45 km-diameter Montagnais submarine impact structure seen in a seismic time structure map.
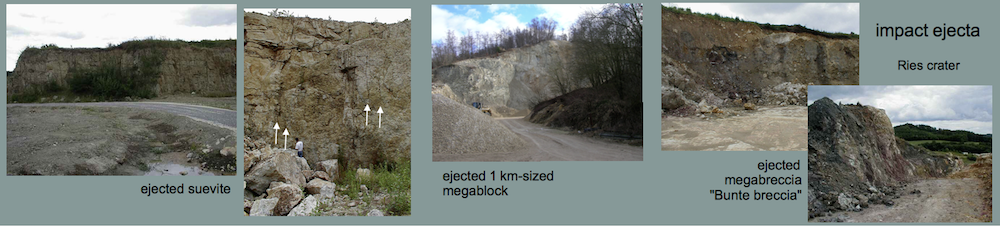
The Ries (Germany) impact structure
As early as in the sixties, extensive seismic surveys were carried out in the Ries impact structure in Germany. At that time, the 26 km-diameter Ries crater was highly disputed by advocates of an endogenetic, volcanic-explosion origin and, on the other hand, by advocates of a formation by meteorite impact. This debate initiated new campaigns of gravity, magnetic, seismic and geoelectric surveys, which contributed to the recognition of the impact origin and to a detailed knowledge of the internal structure of the crater.
The seismic surveys comprised refraction as well as reflection measurements. The location of a seismic refraction profile with respect to the gravity residual anomaly (see Gravity surveys) is shown in Fig. 2.
 Fig. 2. Location of a seismic refraction profile in the Ries crater superimposed on the gravity residual anomaly.
The travel times observed along this profile have been modeled by calculated travel times for a crater model shown in Fig. 3 (modified from Ernstson, K. & Pohl, J. (1977): Neue Modelle zur Verteilung der Dichte und Geschwindigkeit im Ries-Krater [New density and velocity distribution models for the Ries crater ]. – Geologica Bavarica, 75, 355-371.). For comparison, a travel-time curve for an off-crater vertical velocity distribution is plotted, and as can be seen in Fig. 3, travel-time residuals up to 0.4 sec are produced by the velocity decrease in the rocks in the crater area. Both the velocity-depth distribution for the crater center and the off-crater area, as well as the related difference are plotted in Fig. 4.
 Fig. 3. Measured and calculated seismic travel times for the refraction profile of Fig. 2. Also, a travel-time curve for an off-crater vertical velocity distribution is plotted.
For comparison, also the density-depth distribution from a gravity modeling (see Fig. 5) of the Bouguer residual anomaly is plotted. The graphs in Fig. 4 show that at the center of the Ries structure, lowered densities and velocities from impact fracturing can still be identified at depths of at least 5 – 6 km.
 Fig. 4. Velocity-depth distribution for the crater center and the off-crater area, as well as the related difference. For comparison, the density-depth distribution from a gravity modeling (see Fig. 5) of the Bouguer residual anomaly is plotted.
 Fig. 5. Density model for the Ries crater from gravity modeling (Ernstson & Pohl 1977). C
Reflection seismics in the Ries crater area
The seismic-reflection profile (Fig. 6; modified from Angenheister, G. & Pohl, J. (1969): Die seismischen Messungen im Ries von 1948 – 1969 [Seismic investigations in the Ries Crater (1948 – 1969)]. – Geologica Bavarica, 61, 304-326.) radially running from the west to the center of the crater nicely shows details of the geological anomaly which an impact structure may produce in a “normal” geologic environment. In the case of the Ries impact, the target consisted of roughly 600 m well-bedded sedimentary rocks (predominantly Triassic and Jurassic) overlying the crystalline basement (granites, metamorphic rocks).
 Fig. 6. Radial seismic reflection profile crossing the Ries impact crater rim. Click on the image!
The crater rim can be seen by a sudden break of the seismic reflectors merging into a megablock zone without significant seismic energy correlations. The upper and lower boundary of the suevite layer can be traced to suggest the existence of an innermost ring, in good agreement with the results of a geomagnetic and a geoelectric survey (see Geoelectric surveys). Within the inner ring of the crater, the base of the post-impact lake sediments is the most prominent seismic reflector.
Links
THE SEISMIC SIGNATURE OF METEORITE IMPACT CRATERS:
http://www.cseg.ca/publications/recorder/2000/06jun/jun00-impact-craters.pdf
Chesapeake impact structure:
http://geopubs.wr.usgs.gov/open-file/of01-407/
Chesapeake impact structure:
http://pubs.usgs.gov/pp/2005/1688/ak/PP1688_chapI-508.pdf
Steen River impact structure:
www.lpi.usra.edu/meetings/impacts97/pdf/6090.pdf
www.lpi.usra.edu/meetings/lpsc2002/pdf/1736.pdf
The seismic expression and hydrocarbon potential of meteorite impact craters: Current research
http://www.crewes.org/ForOurSponsors/ResearchReports/1997/1997-38.pdf (from 1997)